
The Four KPI Tiles: Mentions, Citations, Detection Rate, Sentiment
Monitor your brand's AI Visibility using the four KPI Tiles—Mentions, Citations, Detection Rate, and Sentiment Score—across AI search results
Mentions, Citations, Detection Rate, and Sentiment Score: The four headline KPIs at a glance
The four KPI Tiles give you all the important answers about your AI Visibility at a glance: How often am I mentioned? How often am I cited? In how many search results do I even show up? And what's being said about my brand?
In this article, you'll learn how a tile is structured and what each of the four metrics tells you.
What you'll find in this article 👇
-
Anatomy of a KPI Tile
-
Mentions
-
Citations
-
Detection Rate
-
Sentiment Score (When Found)
-
Reading order of the tiles
-
Best practices
Anatomy of a KPI Tile
Each of the four tiles is structured the same way:
- Label in the top left in capital letters (for example MENTIONS or DETECTION RATE)
- Headline number large in the middle, showing the current value
- Sub-label small underneath, describing what the number represents
- Trend indicator with ▲ in green or ▼ in red and percentage change
- Sparkline along the bottom, showing the mini timeline of the current period
The colors of the tiles serve as a visual distinction (Mentions metrics, Citations metrics). A green tile doesn't mean the value is "good", just as a red tile doesn't mean it's "bad".
Mentions
The Mentions tile shows how often your brand name was mentioned in AI responses, without necessarily including a link.
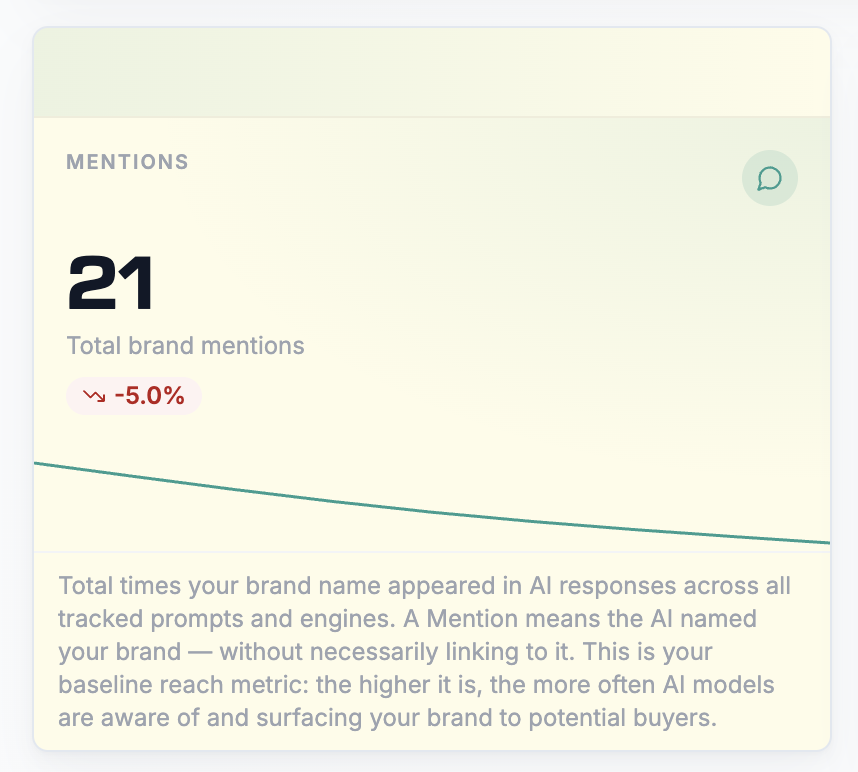
A mention means: The AI model mentioned you by name, whether in a list ("Looker, Tableau, minubo"), in a recommendation ("For e-commerce reporting, minubo is a good fit"), or in a comparison answer. Mentions are the reach foundation of your AI Visibility reporting: no mentions means no visibility.
- Always read the number in the context of your timeframe. "21 mentions in 3 months" means something different than "21 mentions in 7 days".
- Compare mentions with citations. Lots of mentions but few citations means: You're being named, but AI models aren't using your content as a source.
Citations
The Citations tile counts how many times your brand was cited with a link or source reference.
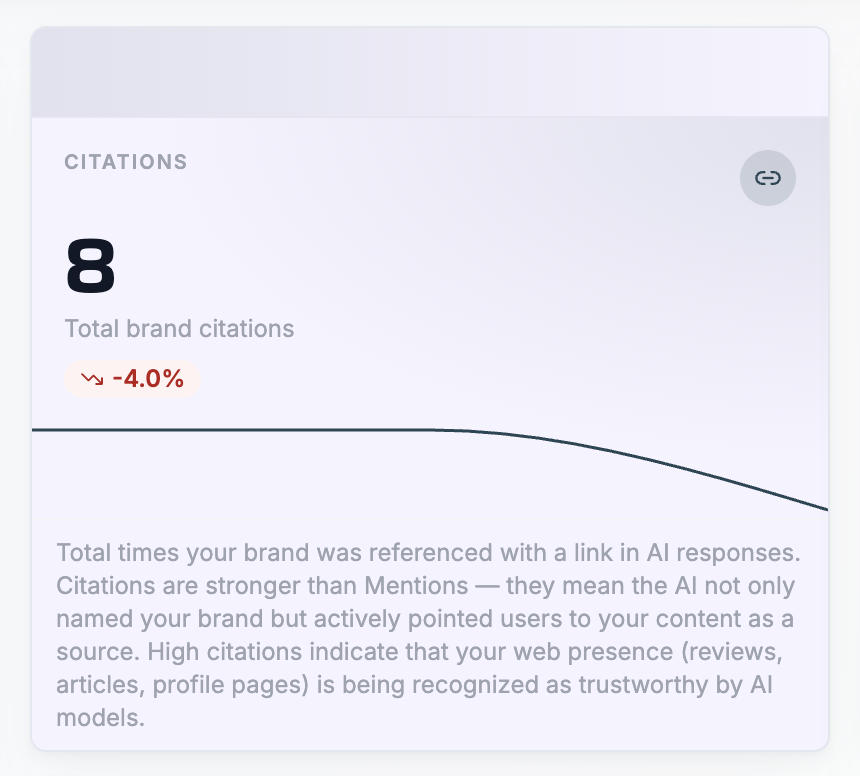
A high citation count is a sign that your web presence (review platforms, articles, profile pages) is considered trustworthy.
Citations don't only come from your own domain. When AI models cite your brand from a listicle on an industry publication, that counts as a citation too. In the article Top Domains & Top URLs by Citations, you can see which domains and URLs your citations come from.
Detection Rate
The Detection Rate is your coverage metric. It answers: "In what percentage of tracked prompts does my brand even appear?"
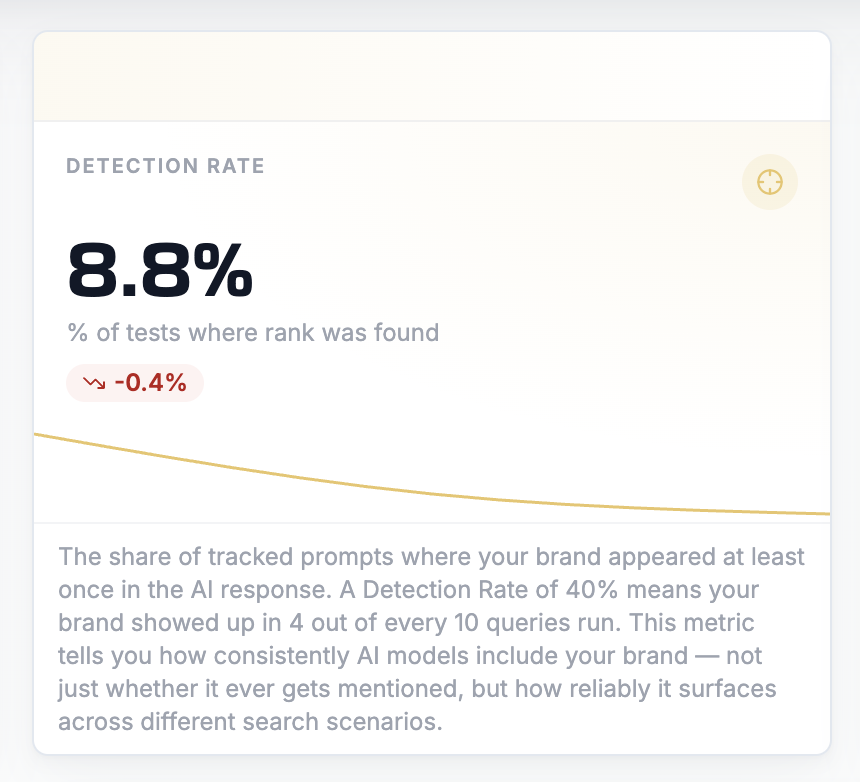
If you track 50 prompts and your brand appears in 4 of them, your Detection Rate is 8%. This is the simplest visibility question: Are we being found or not?
- A Detection Rate below 20% shows that AI models rarely consider your brand, even when the prompts fit your category perfectly. This is usually a content or brand awareness issue.
- A rising Detection Rate without mentions or citations moving proportionally suggests growing awareness.
Sentiment Score (When Found)
The Sentiment Score tile shows the average tonality of your brand in AI responses, measured from negative (0%) to positive (100%).
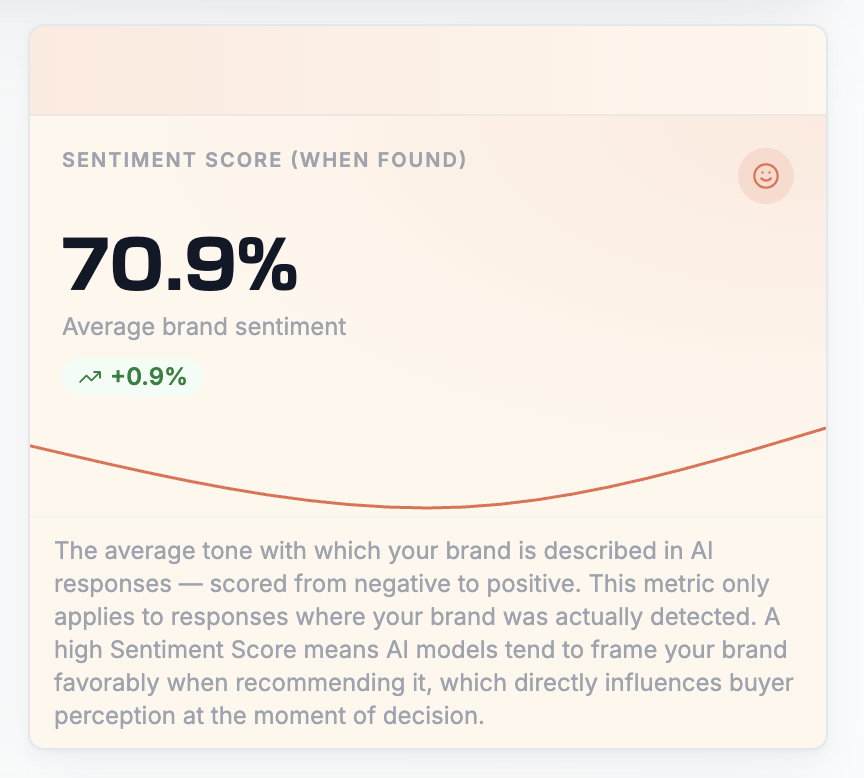
Important in the name: (When Found). The value is only calculated from responses where your brand actually appeared. If your Detection Rate is very low, the Sentiment Score could be based on just a few data points and fluctuate wildly.
Focus on the Sentiment Score only when your Detection Rate is above 20%. Before that, you don't have enough data to draw stable conclusions about tonality.
Reading order of the tiles
The dashboard suggests a proven reading order in the How to use block at the bottom. Stick to it, especially at first:
- Detection Rate first - Are you even in the responses? If not, everything else tells you very little.
- Mentions vs. Citations - Are you only mentioned or also cited? This shows how far your content has already become an AI source.
- Sentiment Score - When you appear, what's the tone? This determines whether the AI recommendation sells you or holds you back.
- Add competition - In the lists under the tiles, you can see where you stand in comparison.
Best practices
Judge trends, not individual values
- Problem: Anyone who overinterprets daily values is chasing noise.
- Approach: Set your timeframe to 3 Months and watch whether the sparkline and trend arrow show a consistent direction. Values only become reliable after two to three weeks of observation.
- Result: You respond to real movements instead of daily fluctuations.
Don't count "no change" as a win
- Problem: When your values stay flat for weeks, it looks harmless in reporting, but it could mean your competitors are moving while you're not.
- Approach: Always compare "no change" in your brand with the movements of your top competitors in the Brand Performance Chart.
- Result: You recognize stagnation as competitive loss and can course-correct in time.
Combine mentions and citations into a story
- Problem: A single KPI never tells the whole story.
- Approach: Always read mentions and citations together. High mentions and low citations mean "well-known but not authoritative". Low mentions and high citations mean "rarely mentioned, but when cited, with evidence".
- Result: Concrete insights into where to focus: building awareness vs. strengthening content sources.
 Powered by happysupport.ai